5.0 SEGY data
5.1 Loading SEGY data
To load observed SEGY data select the ‘Seismic Data’ menu in the Menubar and select ‘Load Segy…’. Next Navigate to the file you want to load and select it. You will them be prompted to enter the dimensions of the SEGY data. The data will then be loaded into the model canvas using these dimensions (plotted as a pyplot image).
Note
The SEGY data must be in the depth domain.
Multiple SEGY files may be loaded into a single model. For example if two sections of the model span two distinct seismic survey lines.
Caution
SEGY data is loaded using the obspy.SEGY.core routine. This requires that all time/date SEGY headers have values. Hence, you may need fill these headers with dummy values using seismic processing software or ObsPy if they are not already present in your data.
5.2 SEGY options
Gain
The amplitude gain can be increased and decreased by either:
selecting the ‘Seismic Data’ menu in the Menubar and then selecting ‘Gain’ ‘Increase…’ or ‘Decrease’
Using the Gain control icons (see Icon Shortcuts)
Color palette
There are currently two color palettes to chose from:
Seismic (red-white-blue)
Seismic (grey scale)
To change the color palette select the ‘Seismic Data’ menu in the Menubar and then ‘Color Palette’ and chose from the options listed.
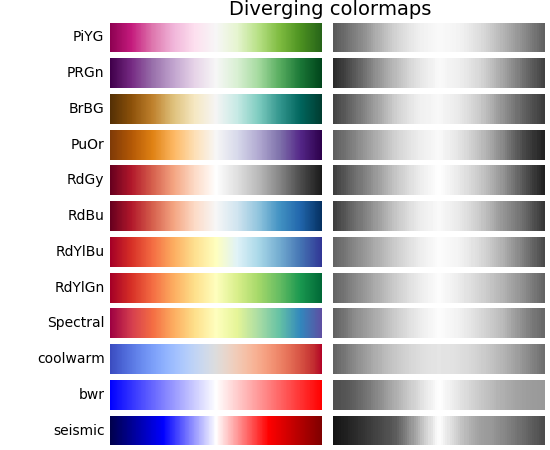
More matplotlib color scales (as shown below) will be added in later versions.
5.3 Deleting SEGY data
If you wish remove segy data from your gmg model, simply navigate to the ‘Seismic Data’ menu in the Menubar and then select ‘Segy Data’ and then ‘Delete’ on the segy file of choice:
Seismic Data -> Segy Data -> Segy FIle -> Delete
Alternatively, if you have more that one Segy file loaded and you want to delete them all, you can use:
Seismic Data -> Remove All Segy...